There was significant refactoring required to generalize the Same Stats, Different Graphs code so it would work for a different input. All of the logic for the target shapes (think the center and radius for a circle, endpoints for a line, etc.) was hardcoded in the code, and was, therefore, specific to the datasets included with the Autodesk team’s code. The positioning and attributes of the target shapes need to be calculated from the starting dataset, with some shapes being much simpler to encode than others. For example, to morph into the circle shape, the center of the circle can be at the mean of the x and y values; the radius can be a multiple of the standard deviation (x or y, pick one):
The target shape Data Morph calculates when trying to morph the panda shown previously into a circle. Distances are calculated from the points to the line that forms the circle.
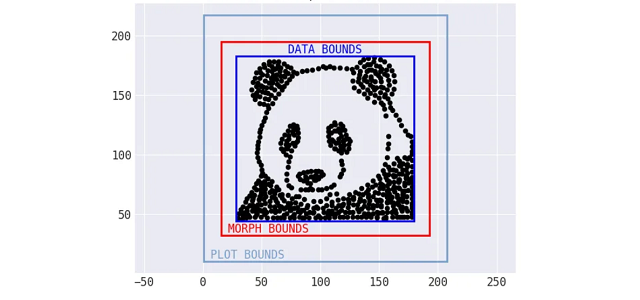
Data Morph provides a hierarchy of shape classes to allow for creating composite shapes (e.g., the circle shape is used to create a bullseye shape, which comprises two concentric circles) and centralizing the distance calculation for streamlined code. However, for some shapes, using information from the data doesn’t quite work: points sometimes need to move outside the bounds of the starting dataset. To handle this logic, Data Morph includes some automatic boundary calculations that shapes and plotting functionality plug into:
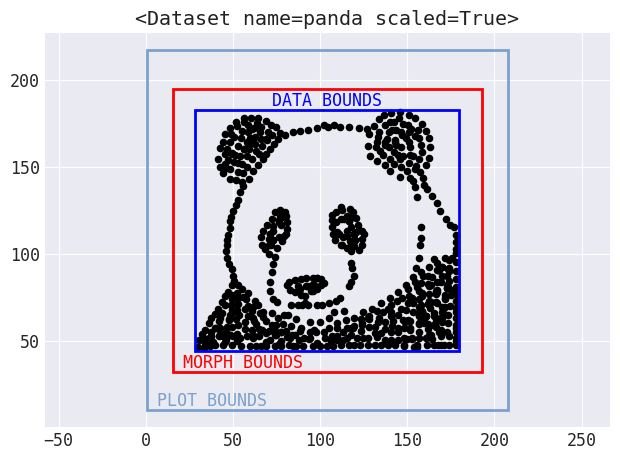
Bounds are automatically calculated for use in morphing and plotting.
Another big change was to decrease the maximum amount the points could move over time, rather than keep it static, which makes for a nicer visual effect as the points move. Here’s an example of morphing the panda dataset into a star:
Morphing the panda dataset into a star with Data Morph.
As the animation above shows, the panda and star not only have the same summary statistics, but so does every single dataset encountered along the way in the transformation process. Compound this with the fact that the panda can also be morphed into several other recognizable shapes, such as the circle that was shown previously, and you have an infinite number of possible datasets matching the summary statistics.
However, there are some limitations: you can’t always morph a dataset into all target shapes offered by Data Morph. If there aren’t any points from the starting shape in a specific region that is part of the target shape, it might not be possible to push the points there without altering the summary statistics. For example, when morphing some input dataset into the rectangle shape, it might be missing some parts of the line(s). Once you play around with different input datasets, you will gain some intuition as to which shapes will work and which won’t (and why).


